This reporting option gives a simple breakdown of enrolled users and the percentage of users for each course status and the ability to drill down by region/division/department. Completion data is displayed in charts for easy breakdown.
For courses with exams, this reporting option will display aggregate data on which answers users are selecting and provide insight into the strengths and weaknesses of your organization’s overall security knowledge. Here you can also gather data on the operating systems and browsers in use when taking training.
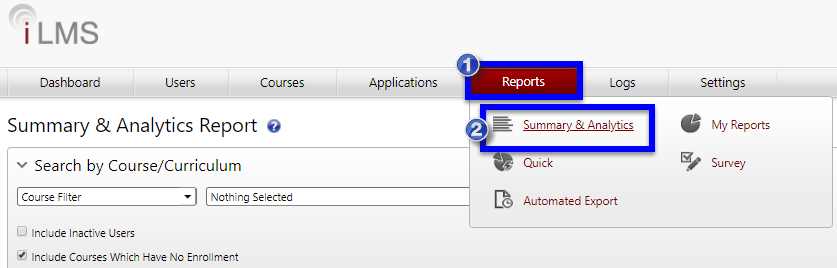
Location:
Reports Tab -> Summary & Analytics
Search Filter
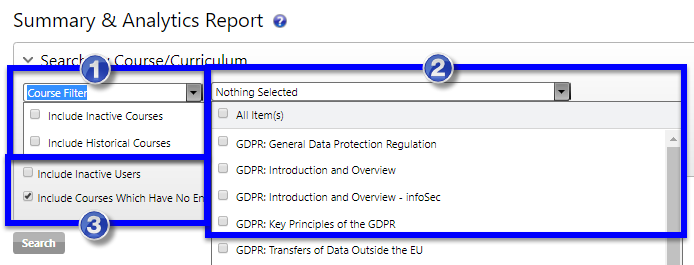
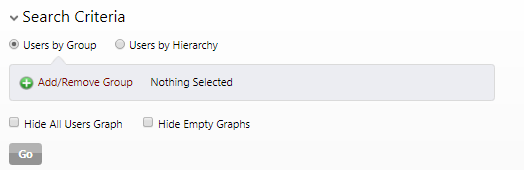
To narrow down the content of the Summary and reports, use the filters to search for the desired data.
1. Here you can specify whether you would like to include inactive or historical courses into the summary, by default courses of this status are not included in results.
2. In the course filter's second dropdown menu you will have the option to select all courses for the summary, or if preferred, the list can include only particular courses indicated by the checkbox.
3. By default, the summary and reports produced by this tool will provide data for only active users, but a checkbox is provided to include inactive users as well when necessary. In this section, you can also choose to remove courses with no enrollees from the results.
Summary
Once filters are specified and the search button has been clicked, a summary will be provided for the selected courses. Below is a brief description of the data provided in each column.
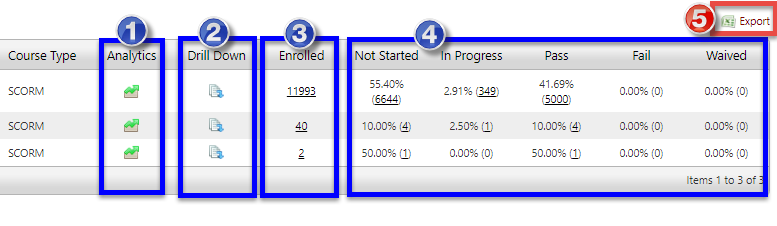
1. Analytics
This option provides a more in-depth breakdown over user performance in the course. The Analytics provide charts depicting overall user progress in the course, as well as a breakdown of exam question responses across the organization, a Threat profile for our security awareness training, browsers used, and other data captured by any IeL adaptive or pre/post test exam training.
- More detail our Analytics feature can be found below: Analytics
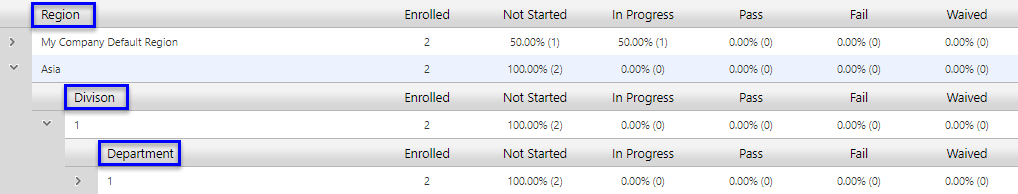
2. Drill Down
The drill down option allows you to see the summary information broken down by branches of the organization hierarchy. With this option, you can see numbers for enrollment and course status by Region, Division, and Department.
3. Enrolled
This number indicates the total number of users enrolled in the course. If you click this number it will display a list of all enrolled users. This list can be exported using the  option to the upper-right of the list of users. The resulting Excel CSV will include the list of users as well as their transcript data for the course.
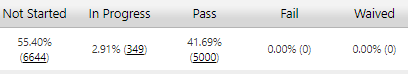
4. Summary by Course Status
On the Course summary, the number of users in each possible Course Status is provided along with a percentage of the total enrolled users.
Clicking the number of users for any status will provide al ist of the users who are currently of that status in the course, and just like with the Enrolled user list mentioned previously, any of these lists can be exported using the  in the upper-right above the user list.
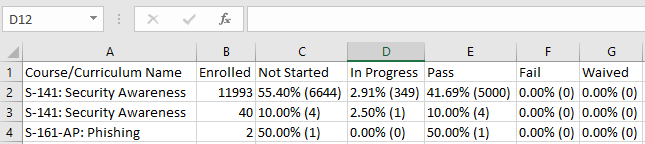
5. Export Summary
The course summary page also offers an export button which will provide a report containing the same breakdown displayed on the page. An example of the report in Excel is shown here:
Analytics - Course Status
This chart displays the percentage of users who have not started. are in progress, or that have passed or failed the training.
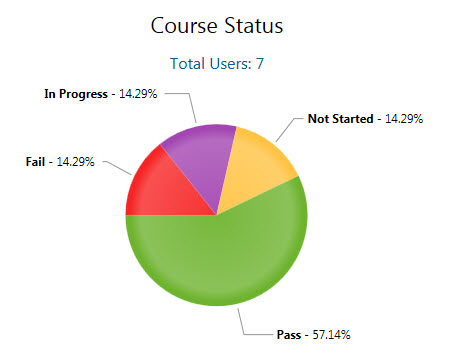
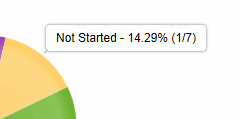
To see the exact user count, hover over any area of the pie or number. For example, as shown in the image below, by hovering over Not Started, an admin can determine that there is 1 user who is in "Not Started" status.
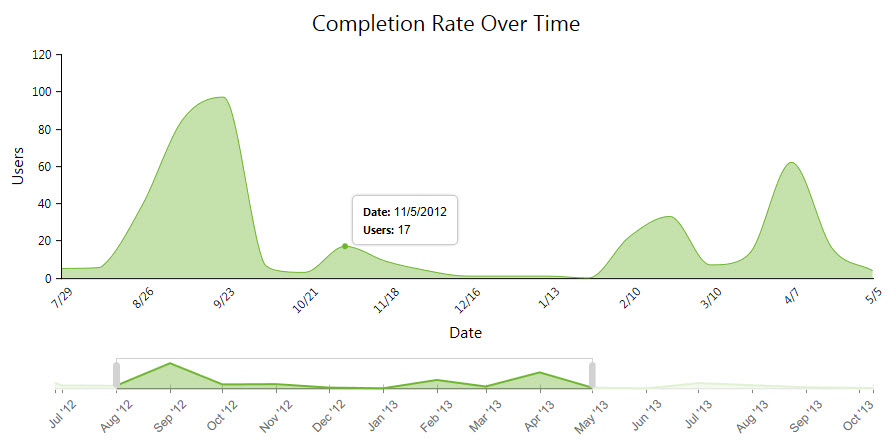
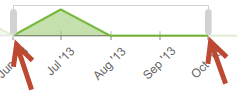
Completion Rate Over Time Graph
This graph represents the completion rate of a course over a period of time. By default, this range is set for the last 3 months of data. You can slide the bottom control left and right to change the 3-month window, or move the ends to create a larger segment of time.
*The start date on this chart will indicate the date when a course is first completed.
You can change the selected range in the navigator by holding and dragging the sidebars as shown below in the desired direction-
Filters
Use filters to target a set of users.
Include Inactive Users:
Use this check box to include the data of inactive users.

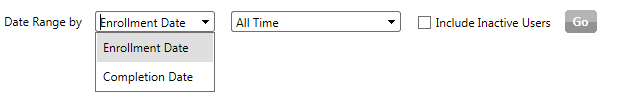
Date Range Filter:
Use this control to filter data based on the selected date range.
Enrollment Date - Select the 'Enrollment Date' option to consider only the users who were enrolled during the selected date range.
Completion Date - Select the 'Completion Date' option to consider only the users who have completed the course in the selected date range.
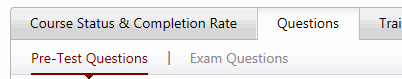
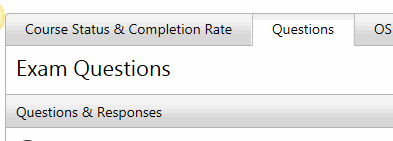
Analytics - Questions Tab
The question section displays exam questions and user responses. In SCORM enabled courses, this information is pulled from the SCORM interactions that are sent to the iLMS.
In Inspired eLearning pre-test enabled courses, the report will contain both a pre-test as well as an exam section.
Any other SCORM compliant course with a final exam will show as shown below.
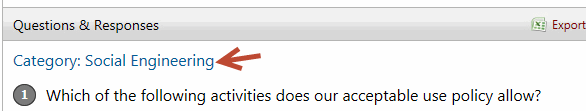
Categories
In applicable Inspired eLearning courses with exams, all questions over a particular subject will be grouped by category.
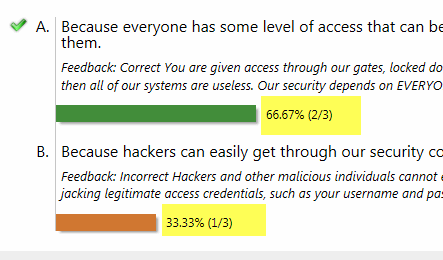
The correct option will be highlighted with a green check mark and the response bar will also be in highlighted in green. Incorrect responses will be in burnt orange.
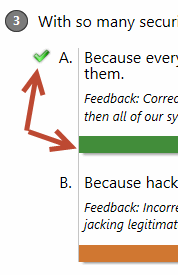
In applicable Inspired eLearning courses, questions feedback will appear below the correct answer.
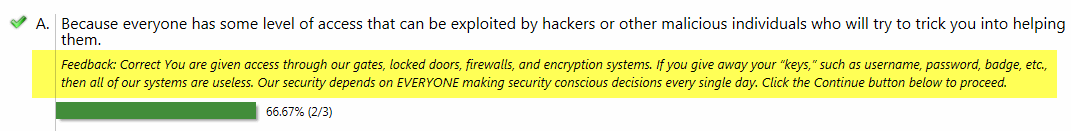
Each answer option displays the % of total users that selected the answer, along with a user count and the total.
For other SCORM compliant courses that deliver only the correct answers, you can easily modify the question text by using the edit icon.

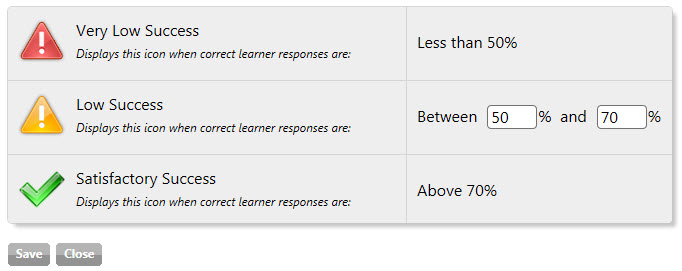
Threshold
This control can be used to adjust the highlighting scheme for which range represents a satisfactory score. This threshold can be set per course and is applicable to both the pre-test & exam (If using an applicable Inspired eLearning course). Use the edit icon to modify the threshold limit.
and then enter values as per your requirement and it will start reflecting in the report as soon as you click on Save button.
Export
Two export options are available for the Questions tab.
Export Summary:
The export summary is a summary of user response data with counts for each option.
![]()
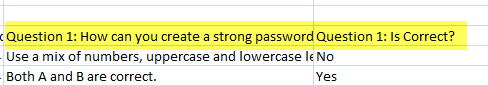
Export All Individuals Responses:
This option exports all user responses for the questions answered.
For every question, you will find a column displaying the question text and another column containing whether or not that question is correct.
Use the print option to print the report.
Filters
Use filters to target a set of users.
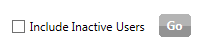
Include Inactive Users:
Use this check box to include inactive user's data.
Date Range Filter:
Use this control to filter data based on the selected date range.
Enrollment Date - Select the 'Enrollment Date' option to consider only the users who were enrolled during the selected date range.
Completion Date - Select the 'Completion Date' option to consider only the users who have completed the course in the selected date range.

Analytics - Employee Threat Profile


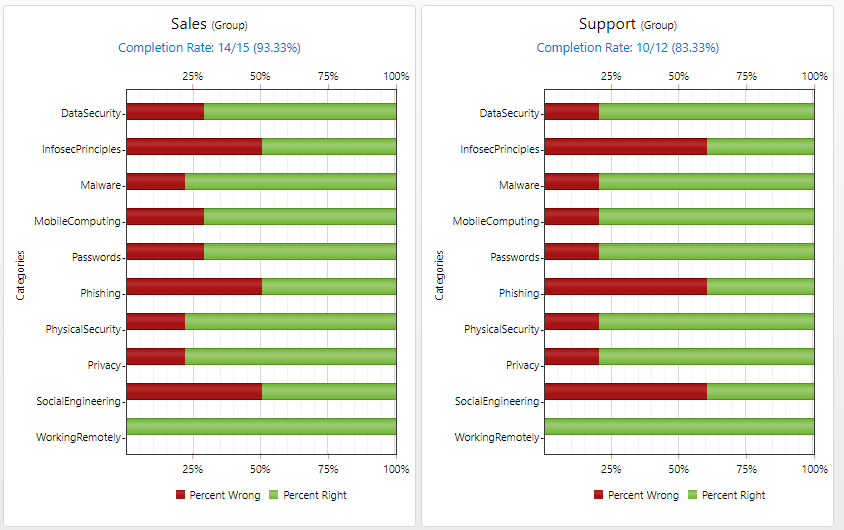
For applicable courses in Inspired eLearning's security awareness library (Generally those that include a Final Exam), we provide a graph identifying the areas of security in which employees were strong, and in turn where they may need more education.
This graph uses the course's exam, with the questions categorized by subject matter to summarize areas of strength and weakness among users who have completed the course.
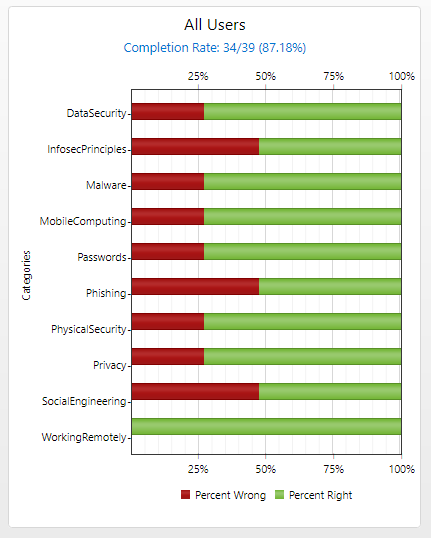
To further break down this data and identify if additional training needs to be provided for certain offices or teams, this data can be separated into graphs for individual groups, regions, divisions, and departments, based on the structure your organization already has in place within our system.
This allows you to compare the areas of strength and weakness across your organizational units, and helps your organization provide additional focus to necessary subjects with teams who may be at risk.
Analytics - OS & Browser Analytics
OS & Browser Analytics helps to analyze the end users' environment in which they are launching the course.
The visitor count is the total number of course launches. For each launch, the system stores the user's environment.
Browser
Displays analytics of various browsers used by users.
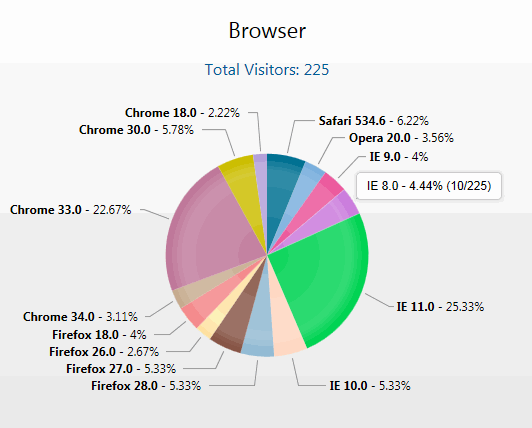
To see the exact number, hover over a section of the pie or number with your cursor. For example, as shown in the image below, by hovering over IE 8.0, an admin can determine that there were a total of 10 launches that happened out of 225 on just that browser.
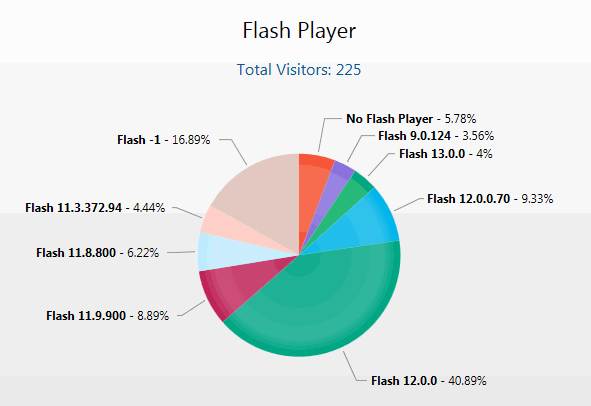
Flash Player
Not as relevant as it once was, but this section displays analytics of various flash player versions installed on a user's machine.
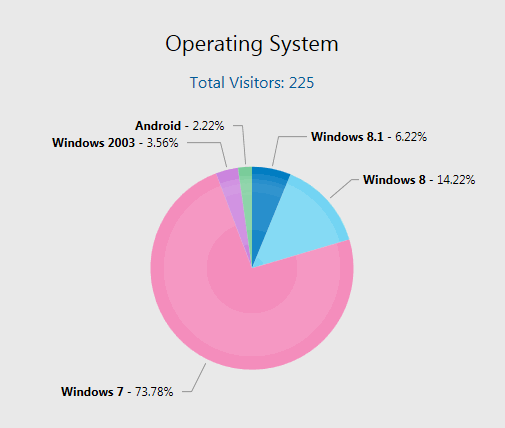
Operating System
Displays analytics of various operating systems from which a course is launched.
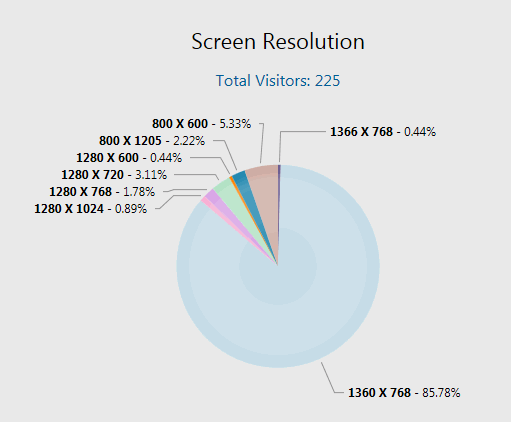
Screen Resolution
Displays analytics of user's screen resolutions.
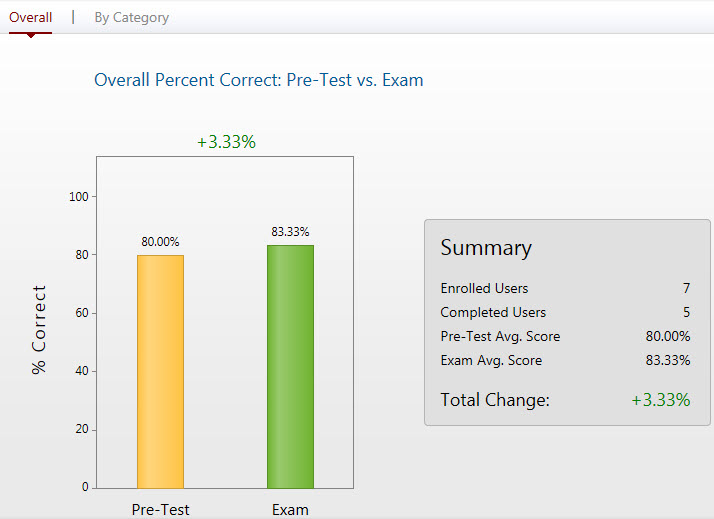
Analytics - Training Effectiveness
(For Courses with Pre and Post Test)
The Training Effectiveness Analysis report is available for Inspired eLearning courses that have both a pre-test and a final exam. This report is designed to measure the effectiveness of the training.
Summary:
This report compares all user's performance as a percentage from the pre-test to the final exam. A positive total change indicates that users performed better on similar questions after viewing the material.
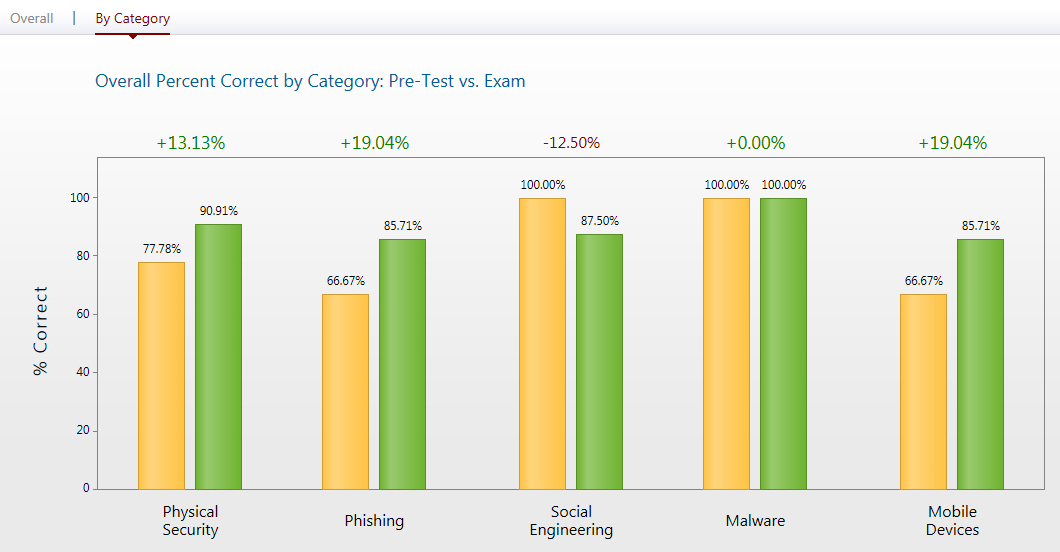
By Category:
This report compares the pre-test and the exam by question category and gives a more detailed view of learner performance. *This capability is only available when using an Inspired eLearning pre-test enabled course.
Analytics - Adaptive Training Analysis
(For Test-Out Courses)

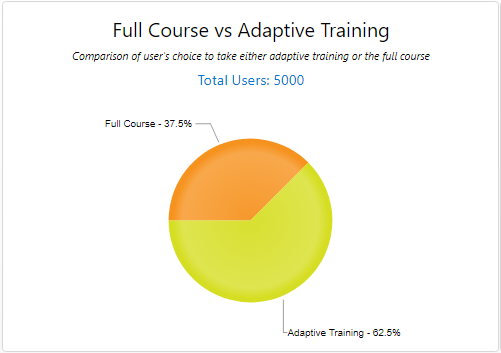
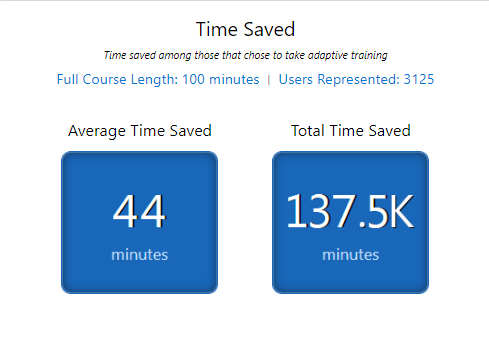
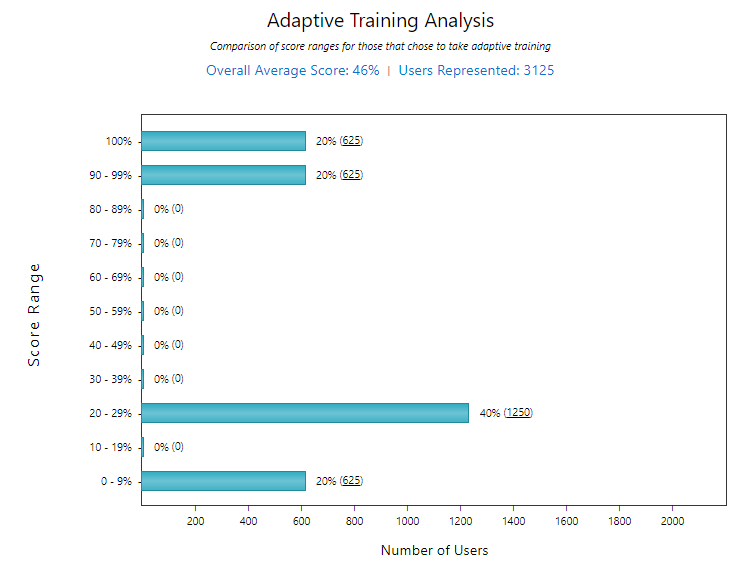
Inspired eLearning offers time-saving training that adapts to the user's strengths and weaknesses on subjects of security. This type of training allows the user to begin with a Pre-Test covering all topics in the content and based on which questions the user gets right/wrong during this test they will only see content covering the subjects on which the user needed additional education. If the user gets all questions related to a certain subject correct they "Test-Out" of that particular section of content and is not required to view content on that subject.
The Adaptive Training Analysis provides insight into how much time was saved, how users scored on the pre-test, and what percentage of users needed the full spectrum of content within the course or opted out of the ability to Test-Out of content sections entirely.